FUNDAMENTAL ANALYSIS
Fundamental analysis aims to provide a comprehensive view of a company's intrinsic value, helping investors make informed decisions about buying or selling its stock based on its underlying financial and operational characteristics. It's often contrasted with technical analysis, which focuses on price trends and trading patterns rather than underlying fundamentals.
.Here are some key aspects typically considered in fundamental analysis:
1. **Financial Statements**: Analyzing the company's financial statements (income statement, balance sheet, cash flow statement) to assess its financial health, profitability, and efficiency.
2. **Earnings and Revenue Growth**: Studying the company's historical and projected earnings growth rates, as well as revenue trends, to understand its growth potential.
3. **Valuation Metrics**: Using metrics such as Price-to-Earnings (P/E) ratio, Price-to-Book (P/B) ratio, and others to determine whether the stock is undervalued, overvalued, or fairly valued compared to its peers and historical benchmarks.
4. **Dividends**: Evaluating the company's dividend history, dividend payout ratio, and dividend yield for income-oriented investors.
5. **Management and Governance**: Assessing the quality and track record of the company's management team, their strategic decisions, and corporate governance practices.
6. **Industry and Market Position**: Understanding the company's position within its industry, market share, competitive advantages (such as barriers to entry), and industry growth prospects.
7. **Macroeconomic Factors**: Considering broader economic factors such as interest rates, inflation, and geopolitical events that could impact the company's performance.
8. **Qualitative Factors**: Including aspects like brand strength, customer loyalty, innovation capabilities, and corporate culture, which can influence long-term success.
-Source: CHAT GPT
STARTING THE ANALYSIS
Since I know you're sick of reading about theory, allow me to present the key elements that will significantly alter your portfolio. Any website can be used to obtain precise information about any business. Two websites that I utilize for my analysis are listed below; I'm only mentioning them for the benefit of my readers; they are not sponsored.
https://www.tickertape.in/ [or just type ticker tape in google ]
https://ticker.finology.in/ [ Data given in compact form ]
[Suggest me through https://finovospheresm.odoo.com/contactus if you get something better]
Initial Steps
Step 1:
Looking at the MARKET CAP : This establishes the company's overall worth. The sum of money needed to purchase the entire business [* Purchasing a business requires many more items; it's not like buying a loaf of bread from bakery]
Why?
In comparison to smaller enterprises, a larger market capitalization typically indicates higher stability and lesser risk. Conservative investors find large-cap stocks appealing since they are typically less volatile and may provide more consistent returns over time.
Step 2:
P/E Ratio [ Price to Earning Ratio ].
Formula: P.E= (Price of Each Share ) / (E.P.S)
also, EPS[ Earning per share ] = (Profit) / (Total Number Of Shares)
Significance,
Market expectations regarding a company's potential for future growth are reflected in the P/E ratio. Strong projected future growth may be indicated by a high P/E ratio, whereas limited growth expectations or undervaluation may be indicated by a low P/E ratio.
- In case of Real Estate and Mining Sector we find PE ratio to be insignificant for analysis.
- Beware of Inconsistent Profit [ex: Seasonal Sale or Lucky Sales due to Exceptional Marketing].
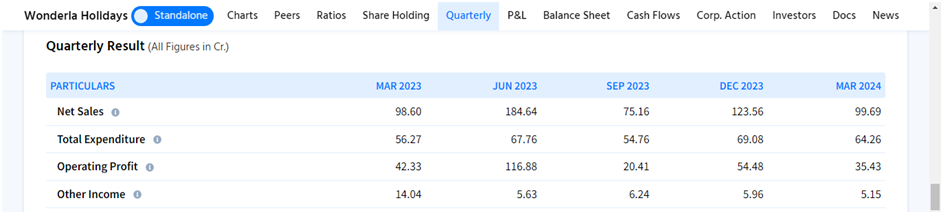
Wonderla Holidays' primary revenue streams are Amusement Parks and Clubs. The screenshot from finology.ticker above makes it evident that the company's highest sales occur during the quarters when schools are closed for the summer and winter.
Step 3:
Enterprise Value:
Formula => Market Cap - Cash + Debt
If the EV is low in comparison to the company's key performance indicators, like earnings, cash flow, or assets, it could indicate that the company is undervalued in the market. For investors looking to purchase stocks at a lower price than their intrinsic value, this may offer a chance.
Step 4:
PB Ratio : [ Price to Book Ratio ]
Amount of Asset [ Money * ] which a company have for every share , is called the Book Value of the Share. It gives an idea of what shareholders might potentially get in the event that a business were to be liquidated and all of its debts settled. In Simple language , If impractically the whole company is sold then the amount of each share that will be received by each sahre holder is known as Book value.
Relevant for which Business?
- The Sector or Business which uses Hard Core Asset.
- Infrastructure , Cement , Bank , Steel , Metal and Mining , Amusement Parks , Oil , Coal etc.
Irrelevant for which Business?
- The Sector where hard core asset is Less or Service Based Business
- Web Development , IT solutions , Software Company , Telecom , etc.
Extras
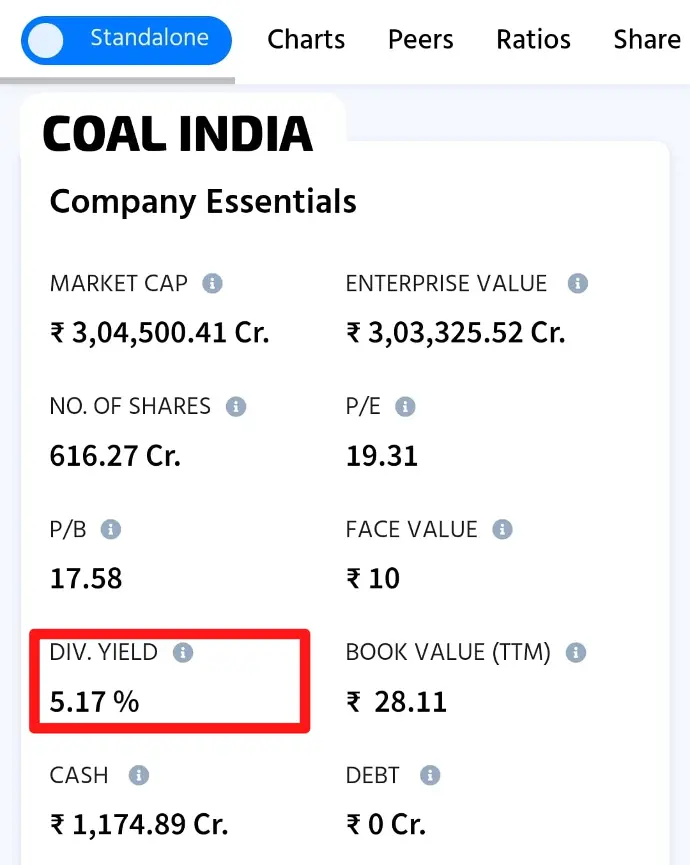
DIVIDEND YEILD :
- A part of Profit Shared among the share Holders
- Some company do not expect exceptional future growth using their Profit. Hence they decide to distribute some part of it among the share holders.
- Conclusion: Higher Dividend yield means Low Growth Company. [* There are few exceptions]
Investment Point:
- Pick a PSU stock with a Good Market Cap and Relatively high dividend yield..
- Buy it during the Bear* Market
Step 5:
- Looking at Promoter Holding: This shows that how much the owner trust his own company.
- Check Promoter Pledging: How much shares has been kept on lease
- Do not check the above 2 points if you are analyzing Bank Stock.
Significance:
It helps in Gaining idea of about Long term Sustainability of the company.
Step 6:
- PAT (Profit after Tax) Margin Percentage:
PAT Margin %=(Net Profit After Tax)/(Total Revenue or Sales))×100
PAT margin percentage indicates how much of every Rupee of revenue a company is able to convert into net profit after taxes. A higher PAT margin percentage generally signifies better profitability, as the company is retaining more profit from its revenue.
Step 7:
- ROE [ Return On Equity ]
This financial ratio assesses a company's profitability in relation to the equity grasped by its shareholders. Investors, analysts, and management use return on equity (ROE) as a key performance indicator to evaluate how well a company is using its equity to generate profit.
BUT !
There is a method by which a company with lower profit margin can present a higher ROE than one with relatively higher profit margin.
Company Do it by taking Debt.
[ Probably you thought that I am going to mention any illegal practise. ]
Let me prove my stance.
CASE 1: LET THERE BE A COMPANY WITH 100cr EQUITY AND 0cr DEBT AND PROFIT EARNED BE 20cr
EQUITY CAP | DEBT @ 12 % | INTEREST OVER DEBT | PROFIT EARNED | NET INCOME | ROE |
100 | 0 | 0 | 20 | 20 | 20 % |
EQUITY CAP | DEBT @ 12 % | INTEREST OVER DEBT | PROFIT EARNED | NET INCOME | ROE |
50 | 50 | 6 | 20 | 14 | 28 % |
In both the cases the company earn 20cr over 100cr.
There is a twist in the formula of ROE [ ROE= ((NET INCOME)/(SHARE holder's Equity))*100 ] just because its has been mentioned to use NET INCOME it has not been specified to exclude the income through the money taken as debt. Hence in Case 2 the net profit is lower than Case 1 but ROE is higher.
Thus this is how a company increases its ROE by taking debt.
CONCLUSION:
DO NOT FORGET TO CHECK DEBT-EQUITY [DE] RATIO BEFORE CHECKING ROE.
DE RATIO closer to ZERO (0) is better. [ except BANK STOCKS ]
Step 8:
- Cash Cycle: Total Time taken to receive the Return or revenue over the Investment made by the company.
- Should be Nearly 0 or Negative for a Good Company.
- Negative indicates that Revenue is generated in advance.
- Hence it highlights the reputation of the company.
Step 9:
- PEG RATIO: [ (Price - Equity ratio)/Growth ]
- PEG > 1 indicates that the stock is expensive
- PEG nearly 1 is a Green Flag.
- Many Good companies typically have a PEG ratio of greater than 1, but it can still be used to determine whether the stock is less expensive than it was a week, month, or quarter ago. Example: 1.35 , 1.27, 1.45 be peg ratios for three quarters of qwerty.ltd. Therefore , Second quarter (1.27) was the perfect time to buy and (1.45) 3rd quarter is the wrong time to buy the same stock.
- It is suggested not to do peer comparison of PEG Ratio.
Step 10:
CFO: [ Cash Flow from Operations ]
A company's cash flow efficiency (CFO) is thought to be more accurate than its net income because it concentrates on actual cash movements as instead of accounting profits, which are subject to change due to non-cash items and accounting policies. A company's ability to pay dividends to shareholders, pay down debt, fund internal growth, and cover operating expenses is evaluated by analysts and investors using the CFO.
Step 11:
Nothing is ever completely perfect; this is true even with stocks. Following the analysis and numerical comparison. It is important to remember that stock market performance is largely dependent on the psychology of individual buyers and their luck. You can view the separate discussion of psychology by clicking the link below.